| Manual |
| Getting Started |
| Starting M-chips |
| Loading data |
| Normalizing the data |
| Filtering the data |
| Exploring the data |
Filtering the data
Why filter your data?
| Correspondance analysis will produce strong relationships of genes to a specific condition the more of the total amount of the signal intensities of one gene over all conditions is associated with that specific condition. Please note that for the tightness of association only the relative values are of importance. Meaning that the intensity level at wich the association is observed is not relevent! | ||
| This makes sense, because you would like to see
associations, but on the other hand this implies a strong need for
filtering. Ratios calculated from genes with low intensity-values
(background-level) tend to be extremly high as well as very inconsistent
which in return can result in very strong relationships in CA.
To avoid this one should filter out genes which are not expressed in the analysed conditions.
Thus, the most important filter for any data (irrespective of the particular
platform they come from) is intensity filtering. In case of multichannel platforms, original intensities do not directly reflect mRNA abundances (or whatever is measured) because of the competition of the channels: A low red channel may either reflect low abundancy of the red mRNA or a great excess of green mRNA that took all the binding sites of the spot. From a low signal we cannot deduce a low mRNA abundance. In order to estimate proper intensities to be used for filtering, M-CHiPS uses the ratios and multiplies them with the gene-wise median of the absolute intensities of the control channels (whenever processing multichannel data).
|
How to operate the filters?
| Select "Edit" in the main menu, select "Filter". | |
| There are filter1 to 3. Only genes meeting the requirements of all three filters survive the filtering. | |
| Klick on any of the three filters: | |
| a) Selected Genes: >= | |
| b) Threshold: | |
| c) Filter by: | |
| d) Filter the: Max (Or) | |
| e) of control (not for quality!): No | |
| f) of condition1: Yes | |
| g) of ... | |
Free combination of above components enables to filter out e.g.
genes never above detection limit (as above),
genes affected by saturation (>=, big thresh., raw intensities, max, all "yes" or conditions affected),
genes below a certain fold-change compared to the control condition (>=, 2,
"by ratios" will account both for >=2x and <=0.5x, max, all "yes"),
genes showing low quality (reproducibility), just to give some examples.
Which filtering to apply?
Saturation (or not)
Saturation effects are visible from the scatterplots displayed during normalization. If you see some dots look like showed into a straight border line by snowplough instead of thinning out in a natural fashion, that's one. If you never see such a thing, you can skip the next paragraph because you do not need a saturation filter.
If the snowplough seemed to have pushed from the right side (vertical border line), there is a saturation effect (i.e. a certain intensity that cannot be exceeded for technical reasons) on the x-axis, i.e. with the control. If the snowplough came from above (horizontal border line), the score that cannot be exceeded is on the y-axis, i.e. with the non-control condition. The intensity that cannot be exceeded can be read from the scatterplot. It should give you a good idea about a threshold for saturation filtering. Saturation intensities may differ from hybridization to hybridization. If the saturation effects are limited to one or two conditions, it seems advisible to deselect all other conditions in this filter - in order not to kill any genes exceeding the threshold only in conditions unaffected by any saturation.
To pick an adaequate quality measure
|
Apart from filtering genes that are not expressed at relevant levels
(intensity filters) it is also possible to filter for reproducibility
measures. Here the repetitions of the conditions are taken into account.
Choose a quality measure according to the number of repetitions you have: 6 or more: Permutation-based tests are best. If you have 6 or more repetitions of each condition, export to SAM (FileI/O, common exports, log2SAM) and re-import the q-values (Edit, p-values, import from SAM). You can also determine a set of genes with a reasonable false discovery rate and import this set back for filtering. 4 or more: If you have beween 4 and 6 repetitions, you can use eBayes - computed pvalues (Edit, p-values, then filter by pvalue). 2 to 3: If you have extemely low numbers of repetitions, use minmaxseparation (explained below) .
|
|
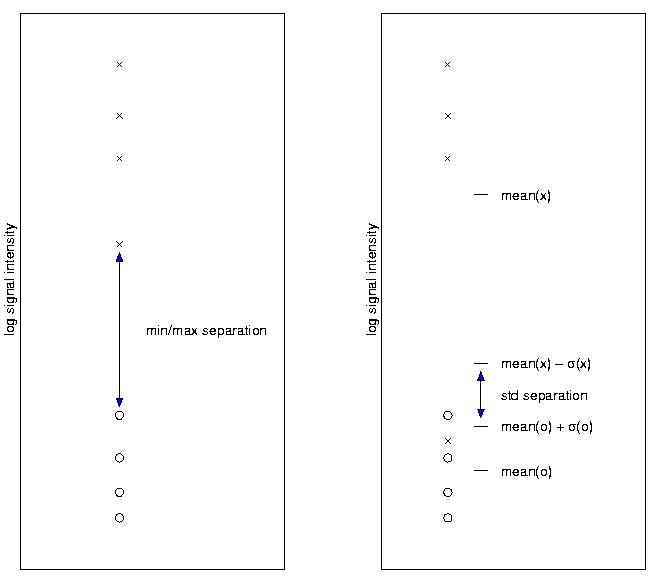
| The x representing the repetitions of one gene in conditionA and the o's representing the repetitions of the same gene in (for instance) the control condition. The difference between the max(o) and min(x) is the Minmax-Seperation. | ||
| The Std. deviation seperation should be applied when a high number of repetitions is available. This method is less restrictive than the Minmax-Sep. and accounts for the higher chance of obtaining outliers (as in the figure) when increasing then number of repetitions. | ||
|
KEEP IN MIND:When applying this filter you will most likly see well
seperated clusters in CA, BUT this must not necessarly be the 'natural'
information that was in your data, since you filtered out all genes that did
not have any seperation from your control condition!! These measures are motivated by having at hand low numbers of repeated measurements (in comparison to experiments e.g. in physics). See /mchipsocgi/faqdb?attrib1=keywords&constr1=filtering or e.g.
http://kups.ub.uni-koeln.de/volltexte/2003/364/pdf/11w1296.pdf for details.
Filter strategies
1. The most important filter is an intensity filter! Its purpose is to discard all genes that remain below the detection limit under all conditions under study. Some of these have highly significant p-values, most of them large ratios, a.s.o. That's why there is no substitute for intensity filtering. 2. If there are any saturation effects visible during normalization, see to it that you get rid of them, next. 3. Perform a CA without HMS to identify (and delete: Edit - Drop - measurement) outlying hybridizations. A single bad hyb can mess up your whole filtering process! In many cases, outliers are already recognizable by low correlation coefficients (during normalization). Until now, no bias has been introduced! Please keep in mind that following measures favor the false-positives over the false-negatives! 4. To increase clarity of the whole picture, you may apply a quality filter. 4.1 A ratio-filter is largely redundant - the quality filter will have killed all the genes that do not change. E.g. for CA, they would be in the middle of the plot where you do not see them, anyway. You may want to apply it to produce color-coded lists including exclusively genes of the magic 2-fold change, though >;-)) (sorry for being bitchy). For a recipy of how to find thresholds and what to start with and what to do next, please have a look at our workflow suggestion. |