 |
Complete annotation of the described multiconditional experiment is listed in the data section below. There are 8 annotation items (Tab. 2), that are over- or under-represented in the outlying measurement cluster of Fig. 3. These annotations are possible candidates to explain the cluster formation. Some can be excluded when considering their meaning in the experimental context. The annotation `incubation period' records the time points, and `temporary additive' describes whether or not hydrogen peroxide was present in the growth medium, both only reflecting that the selected measurements belong to the 30-minutes timepoint. `Label incorporation rate' and `total activity' of incorporated label can be also disregarded for characterization of the cluster, because values annotated for the measurements in the cluster show up in mid-range for both annotations in table 2. The value ranges of these annotations which represent continuous variables can be discretized into appropriate bins (intervals) due to their particular distribution or by expert knowledge. Discretizing of continous-range annotations is necessary for analysis of experiments comprising high numbers of measurements (not shown). The absence in the cluster of a particular `experimentator', who performed 2 out of the 12 measurements outside the cluster is unlikely to explain the difference between cluster and other measurements. The same applies to not rehybridizing the array for the 5th or 6th time (annotation `array_hybridization').
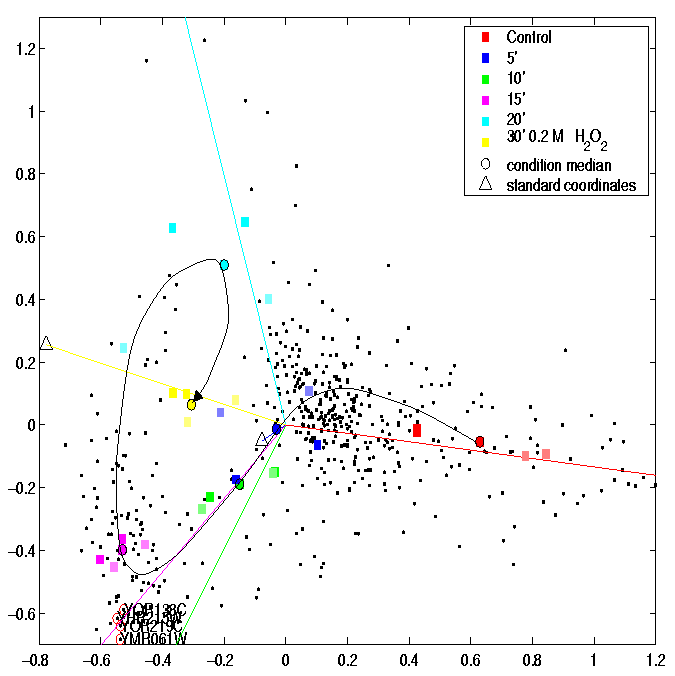
The first two annotations listed denote that the entire cluster was hybridized on `array individual' 6 which is the only one stemming from `array series' (i.e production batch) 59, whereas all other arrays were of series 61. The differential array batch used for hybridization in the selected measurements causes their profiles to be different. The correspondence analysis plot in Figure 3 shows them clearly separated not only from the remaining measurements of the 30 minutes timpoint but also from all other measurements. This artifact distorts the projection of an otherwise sound and revealing dataset as shown by omiting the two outlying measurements for analysis.
Figure 4 reveals a leap in transcriptional status of the cells between 15 and 20 minutes after begin of treatment, consistant with the work of Godon and co-workers [1]. This includes both genes with increased and decreased transcription levels. As an example for a marked expression pattern we selected a cluster of 4 genes being activated in the initial phase of the response but downregulated after 20 minutes. Their profiles are drawn in Fig. 5.
Material and experimental methods. Yeast strain
FY1679 (MATa/MATa ura3-52/ura3-52 trp 63/TRP1 leu2
 1/LEU2
his3
 200/HIS3 GAL2/GAL2) was grown to mid-logarithmic
growth phase when the culture was split and hydrogen peroxide added to a
final concentration of 200 mM. Samples were taken 5, 10, 15, 20 and 30 min after
treatment. Cells were harvested for RNA preparation as
described [2]. Radioactive labelling by
reverse transcription and hybridization to the PCR-based whole genome DNA-array
were performed according to [2]
as well.
Computational methods. The raw intensity data as obtained from AIS imaging software (Imaging Research Inc., St. Catherines, Canada) were normalized as described [3]. After normalization the data were filtered for genes fulfilling the following criteria:
Data table. This tab delimited table includes both the raw intensities as computed by AIS imaging software and the preprocessed data ready for high-level analysis. The table lists raw and normalized data for primary and secondary spot of each gene on the filters. It also contains reproducibility measures and gene-wise medians used for filtering and correspondence analysis, respectively. The filtered set of 508 genes are marked by an asterisk in the first column.
Experiment annotations. The HTML document holds the experiment annotations for the described experiment. It is divided into condition-dependent, measurement-dependent and constant annotations and comprises also the measurement-dependent annotations for measurement no. 60 and 61 which are omitted in the above analysis but included in Fig. 3.