| name | size | class | content |
| backgroundsubtraction | 1 x 13 | char | 'subtracted', 'not_subtracted', or 'not_available' (meta data) |
| ca | 1 x 1 | struct | recording last correspondence analysis (for updating figures) |
| casuppmode | 1 x 1 | double | determines which kind of supplementary points to plot in CA |
| ccthresh | 1 x 1 | double | correlation coefficient threshold for hybridizations (meta data) |
| closehybgaps | 1 x 1 | double | boolean: 0=plot hybs by measurement ID, 1=by download sequence (no gaps) |
| corranafig | 1 x 4 | double | handles of CA figures (2D, 3D, barplot, not used) |
| corranafigplotted | 1 x 4 | double | boolean register of which CA fig. is currently existing |
| displaysize | 1 x 2 | double | for maximal size of certain figures (e.g. overview fig.) |
| distprim | ngen x nexp | double | distance to control condition (analog to ratio), primary spotset |
| distsecu | ngen x nexp | double | distance to control condition (analog to ratio), secondary spots |
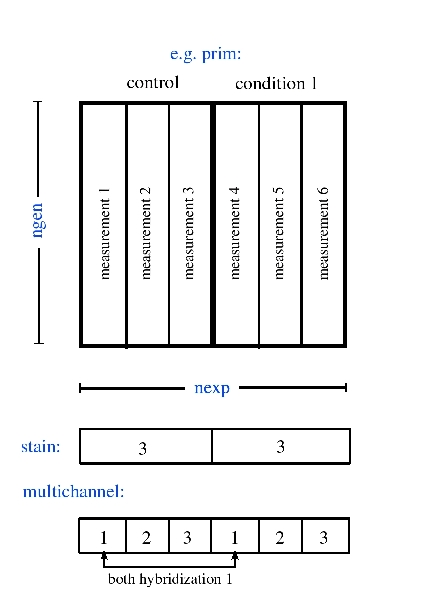
| experim | ngen*) x nexp | double | measurement IDs (as in database attribute "tableno") in ngen x nexp format (compatible with the large data matrices) |
| experiment_tables | 1 x ncon | cell | measurement IDs by conditions |
| family | 1 x ? | char | array family (type of chip), e.g. hb4 |
| filterbytimepoints1 | 1 x ncon | double (logical) | boolean register of all conditions taken into account by filter 1 |
| filterbytimepoints2 | 1 x ncon | double (logical) | boolean register of all conditions taken into account by filter 2 |
| filterbytimepoints3 | 1 x ncon | double (logical) | boolean register of all conditions taken into account by filter 3 |
| filtermode1 | 1 x 4 | double | number representation of everything else selected for filter 1 |
| filtermode2 | 1 x 4 | double | number representation of everything else selected for filter 2 |
| filtermode3 | 1 x 4 | double | number representation of everything else selected for filter 3 |
| fitconditionmedians | ngen x ncon | double | absolute intensity for each gene and condition (genewise medians of each condition within fitprim) |
| fitcondmediansratio | ngen x ncon | double | linear ratios for each gene and condition (fitconditionmedians/median(control measurements)) |
| fitprim | ngen x nexp | double | normalized signal intensities (estimated for multi-channel data), primary spotset |
| fitsecu | ngen x nexp | double | normalized signal intensities (estimated for multi-channel data), secondary spotset |
| flatprim | ngen x nexp | double | (linear) ratios, primary spots |
| flatsecu | ngen x nexp | double | (linear) ratios, secondary spots |
| fpvalue | ngen x nexp*) | double | multi-class pvalue (f-statistic - based, computed by limma::eBayes; or imported from permutation test) |
| gen | ngen x nexp*) | double | gene ID number (database attribute "spotno"), large datamatix format |
| geneinfomode | 1 x 1 | double | way of representing genes in web browser (see view - settings - show what - geneinfo) |
| geneorder | 1 x ngen | double | gene index (containing gene ID numbers out of {1..ngen} that survived filtering, sequence determined by sorting |
| ginfo | 1 x ngen | cell | gene annotations |
| ginfoheader | 1 x ? | char | attributes of gene annotations |
| histofig | 1 x 4 | double | handles of histogram figures |
| histofigplotted | 1 x 4 | double | boolean register of histogram figs. |
| histomode | 3 x 5 | double | number representation of View - Modes - Histogram Mode |
| linminmaxseparation | ngen x ncon | double | minmax sep. on linear abolute intensities (instead of log ratios) |
| linstddevseparation | ngen x ncon | double | stddev sep. on linear abolute intensities (instead of log ratios) |
| lowess_fraction | 1 x 1 | double | local window size for lowess normalization (default: 0.05) |
| medbool | ngen x ncon | double | 1=upregulation, 0=downregulation |
| minmaxseparation | ngen x ncon | double | explained here in Fig. 5 |
| multichannel | 1 x nexp | double | hybridizations affiliated to the measurements, see here |
| myfig | 0 x 0 | double | contained fig. handle of browser figure, now empty |
| nexp | 1 x 1 | double | number of measurements |
| ngen | 1 x 1 | double | number of genes |
| normalization | 1 x 48 | char | normalization algorithm (meta data) |
| overviewfig | 1 x 5 | double | handles of overview figures |
| overviewfigplotted | 1 x 5 | double | boolean register of overview figs. existing at present |
| overviewmode | 4 x 4 | double | number representation of View - Modes - Overview Mode |
| partition | ngen x 2 | double | first column contains gene IDs, second column the affiliated partitions: See here. |
| partitionmode | 1 x 1 | double | partition to be analyzed (0 = all) |
| port | 1 x 4 | char | port no. for inter-process communication |
| prim | ngen x nexp | double | raw data (primary spotset) |
| prim_bkg | ngen x nexp | double | local background as obtained from imaging software (primary spotset) |
| pvalue | ngen x nexp | double | two-class pvalue (computed by limma::eBayes; or imported from permutation-based test) |
| rankprim | ngen x nexp | double | ranks (primary spots) |
| ranksecu | ngen x nexp | double | ranks (secondary spots) |
| ratio | ngen x ncon | double | ratio (linear scale) |
| secu | ngen x nexp | double | raw data (secondary spotset) |
| secu_bkg | ngen x nexp | double | local background as obtained from imaging software (secondary spotset) |
| selection | 1 x 1 | cell | database structure 1 - style (zero padded) measurement IDs by MCE (multiconditional experiments in the browser selection). Normally, the data selected in the browser is merged into only one MCE before download. Therefore, this variable normally has size 1x1. |
| showwhat | 1 x 4 | double | boolean register of what to show (overview, zoom, quality, histogram). Select with View - Settings - Show What. Activate with View - Update View. |
| sortbytimepoints | 1 x ncon | double (logical) | boolean register of all conditions taken into account for sorting |
| sortmode | 1 x 2 | double | number representation of everything else selected by Edit - Filters - Sort |
| stain | 1 x ncon | double | number of measurements for each condition |
| stainb | 1 x ncon | double | e.g. stainb(3):staine(3) yields column index of condition 3 in ngen x nexp - data matrices |
| staine | 1 x ncon | double | see stainb (previous line) |
| statisticsfig | ncon x 5 | double | handles of quality figures |
| statisticsfigplotted | ncon x 5 | double | boolean register of quality figs. existing at present |
| statisticsmode | 3 x 4 | double | number representation of View - Modes - Signal Quality Mode |
| stddevseparation | ngen x ncon | double | explained here in Fig. 5 |
| timepoint_is_control | 1 x ncon | double | boolean register of control condition(s). Normally the first one (if not deleted, e.g. by Edit - Drop - Controls), only (for browser - selections comprising only one MCE) |
| x | ? x 1 | double | Selected genes (red circles and black text in CA fig.). Please note that x indexes an index: Gene IDs (= row numbers in a ngen x nexp - matrix) are obtained by geneorder(x) !!! |
| xblue | 0 x 0 | double | green gene tags, unlike x directly indexing gene IDs |
| xgo | 0 x 0 | double | selected gene ontology terms |
| xgreen | 0 x 0 | double | green gene tags, unlike x directly indexing gene IDs |
| xhyb | 0 x 0 | double | measurement tags (directly indexing measurement IDs (= columns in any ngen x nexp data matrix) |
| xred | 0 x 0 | double | red gene tags, unlike x directly indexing gene IDs |
| zoomfig | 1 x 5 | double | handles of zoom figures |
| zoomfigplotted | 1 x 5 | double | boolean register of overview figs. existing at present |
| zoommode | 4 x ncon | double | number representation of View - Modes - Zoom Mode |
Please note that depending on the kind of data loaded / functions invoked (e.g. using GO annotations), above list may be incomplete. If you stumble upon a variable that escaped documentation until now, please let me know.