| Characteristics: |
| Correspondence Analysis |
| Planar embedding |
| Interpretation |
| Storing annotations without freetext |
| Why? |
| How? |
| To what end? |
To look into the interpretability of such a plot, let's consider to explain
a fictitious example of 6 hybridisations and 24
genes:
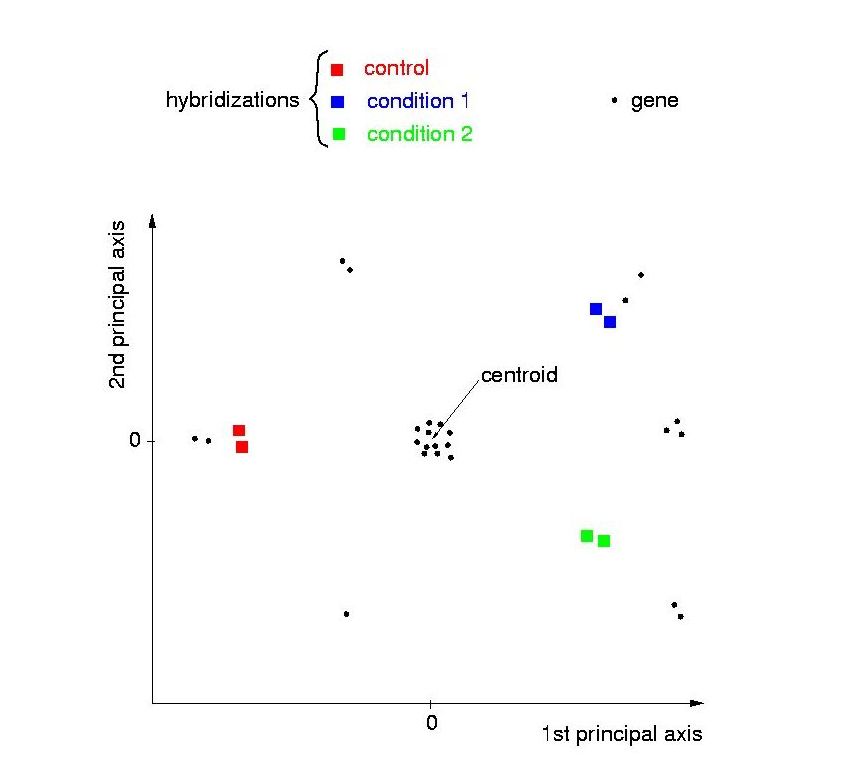
The genes are depicted as black dots, the hybridizations as boxes,
color-coded according to the experimental condition they belong to. Each condition comprises two repeated hybridizations.
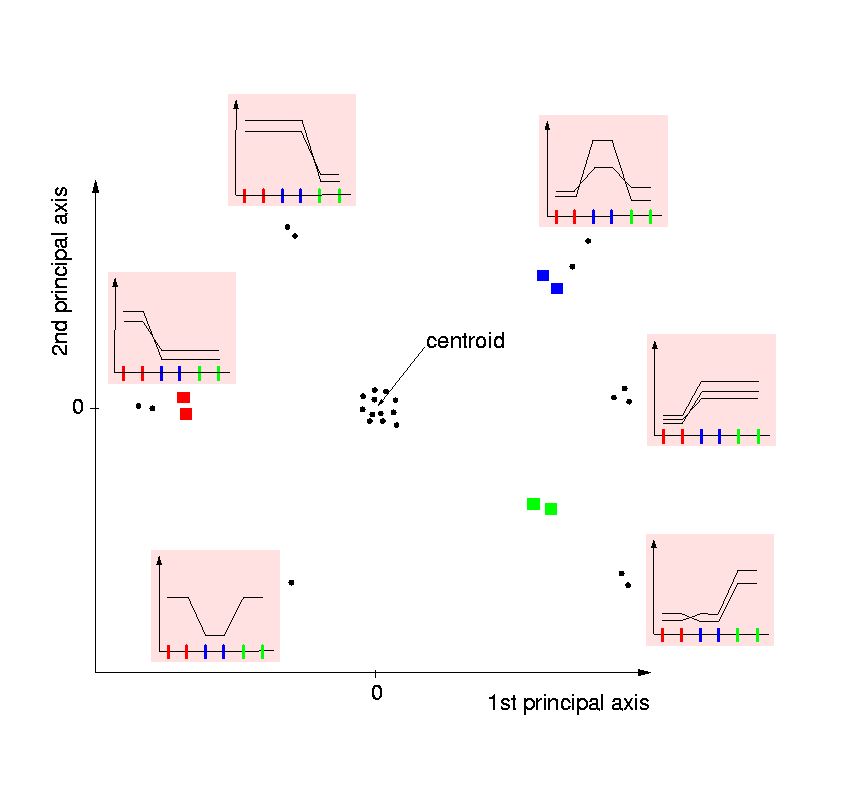
The following properties of such a plot are useful for its interpretation:
- Hybridizations showing high similarity in expression profile, for
example because they belong to the same experimental condition, have a short
distance in the 24-dimensional gene space, and therefore they will be
neighbors in the projection as well.
- Genes with high intensities in a condition are located in the direction
of this condition. The two genes located in the direction of the blue
condition (upper right corner) are both upregulated particularly in the blue
condition:
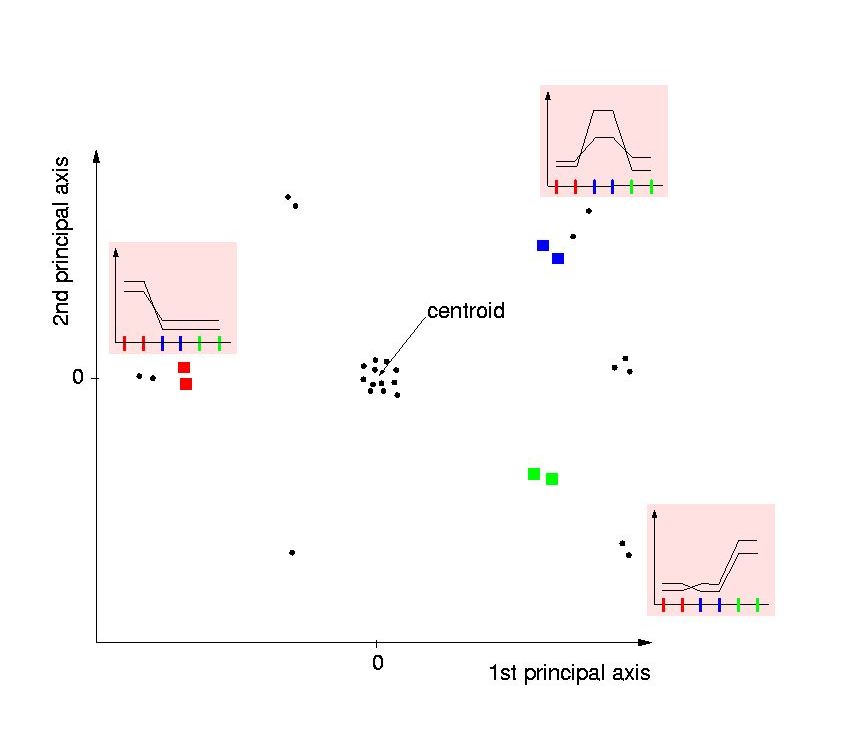
- Genes particularly downregulated under this condition are located at the
opposite side of the controid. One can regard the gene in the lower left corner
as being downregulated in the blue condition. Another valid interpretation
is, that it is located in the direction of the bisection line between the
read and the green condition because it is equally abundant in these two
conditions:
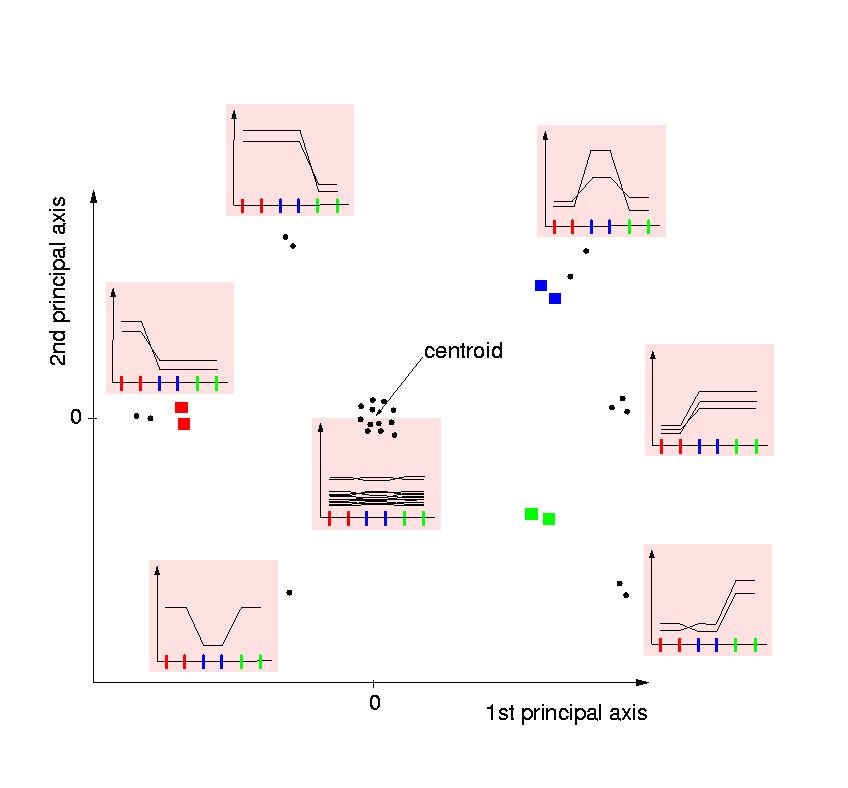
- All genes with unchanged expression, or those not expressed to a measurable
amount in any of the conditions under study are located near the centroid.
For experiments with comprehensive or complete gene sets, i.e.
sets not particularly selected for high expression, the genes that are
not detectable will be the majority. The plot will show a centric cloud of
many genes lacking significantly
changed expression throughout the experiment.
The outer regions of the plot will contain the so-called `differential'
genes.
Their distance to the centroid will reflect the significance of displaying
differing expression from the `average' ones in terms of chi-squared
statistics, which are placed at the center of the plot:
Fellenberg K, Hauser, NC, Brors B, Neutzner A, Hoheisel JD, Vingron M.
Correspondence anaylsis applied to microarray data.
Proc Natl Acad Sci USA (2001) 98: 10781-10786
[abstract]
[pdf]
[data].
Microarray studies may record variations in time, genotype,
desease status, cellular environment or combinations of those.
Most experiments stored comprise more than two experimental conditions, each recording a
certain state of a particular biological sample. Thus, more information
needs to be stored
than the hybridization intensities alone:
