| Characteristics: |
| Correspondence Analysis |
| Planar embedding |
| Interpretation |
| Storing annotations without freetext |
| Why? |
| How? |
| To what end? |
Some cells are growing under particular experimental (or clinical) conditions. Their mRNA is prepared, labelled and hybridized on an array - here binding to the complementary DNA fragments immobilized on the array surface. Thus the signal intensity corresponding to the mRNA abundance can be oberserved gene by gene. There are variants in labelling but for simplicity I will stick to this approach only.
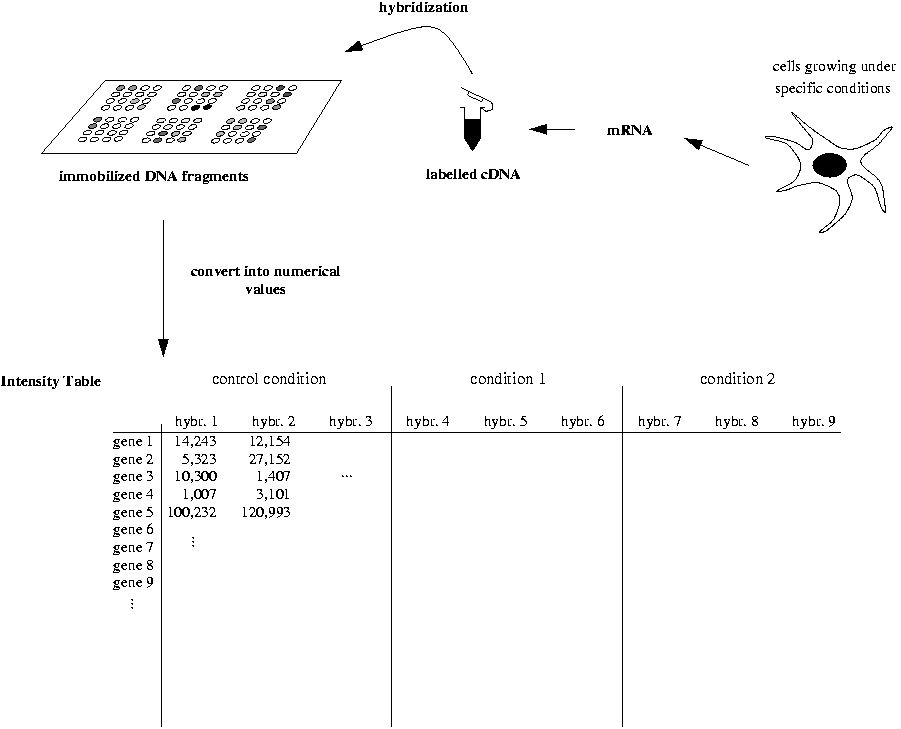
Now the signals for each gene are converted into numbers by some imaging software. One can regard them a table longer than wide with each row containing a gene profile. Each column stands for a hybridization with several repeatedly performed hybridisations representing an experimental condition. The first condition - let it be the control condition - serves as an anchor for normalization and comparison with other multiconditional experiments.
This table is now undergoing a normalization and a filtering process (more details) resulting in a transformed and extracted data table yet too large for interpretation. Let's look at the hybridisations as being vectors in the gene-dimensional space:
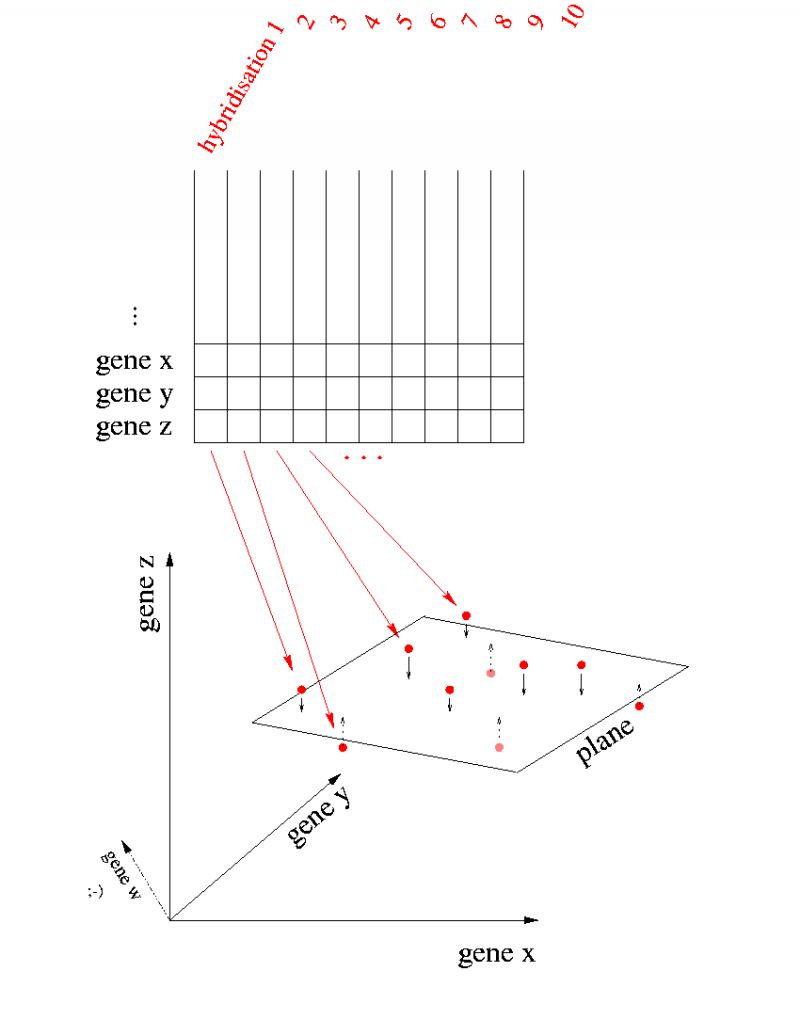
In the case of yeast, there are about 6000 genes, so each vector will have 6000 coordinates. Here, we look at 10 hybridisations depicted as dots in this 6000 dimensional coordinate system. For obvious reasons, only the last 3 axes for the last 3 genes are drawn. Just keep in mind, that there are some 5997 more ;-).
Now the aim is to project the red dots onto a 2 dimensional hyperplane such that the overall distance of the dots to the plane is minimal, conserving the dot-to-dot distances as well as possible. Analogously to projecting the hybridisations, one can do so for the genes (in hybridization-dimensional space) as well.
But moreover one can project both gene profiles and hybridisation profiles
into a common subspace of low dimensionality, for example into a 3
dimensional space one can look at or onto the very same plane. That's what
correspondence analysis does.
Rather than looking into what is the
mathematical machinery behind this (more details), let's see how
such a projection plane looks like and what we can learn from it.
