| Characteristics: |
| Correspondence Analysis |
| Planar embedding |
| Interpretation |
| Storing annotations without freetext |
| Why? |
| How? |
| To what end? |
The plot shows a correspondence analysis of a timecourse of yeast cells responding to 200mM hydrogengenperoxide in their medium.
But the yellow 30' condition is all divided into two parts or clusters
located far away from each other.
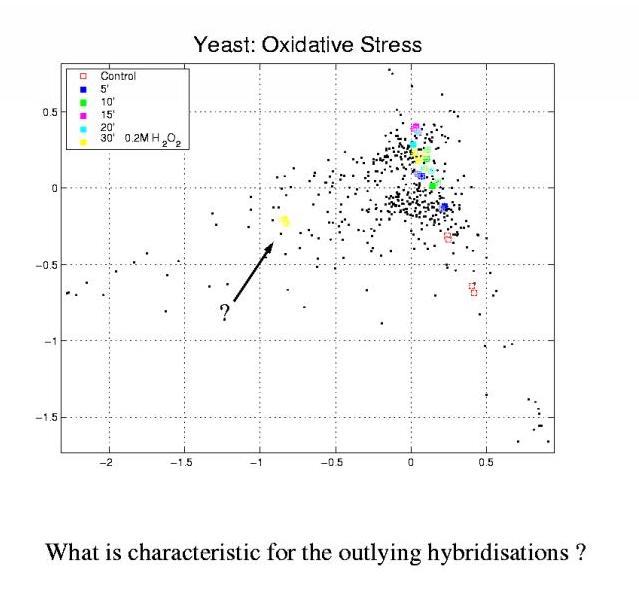
In other words: Can we find features in the experimental description
which are characteristic for the outlying cluster? Are there annotation
values overrepresented in the cluster? Or are there values missing or
underrepresented in the cluster?
To look into this let's have a look at an easy-to-explain example. Instead of using the chi-squared-test to determine, which annotation values are characteristic, let's consider a simple way to access these associations. There's a yeast-specific annotation 'growth phase', which can take one of three values: exponential, stationary or pseudo-hyphal. This is just to have an example. It could be any other annotation as well. So just think of the values as boxes, polygones and triangles and let's focuse on the triangles for a while.
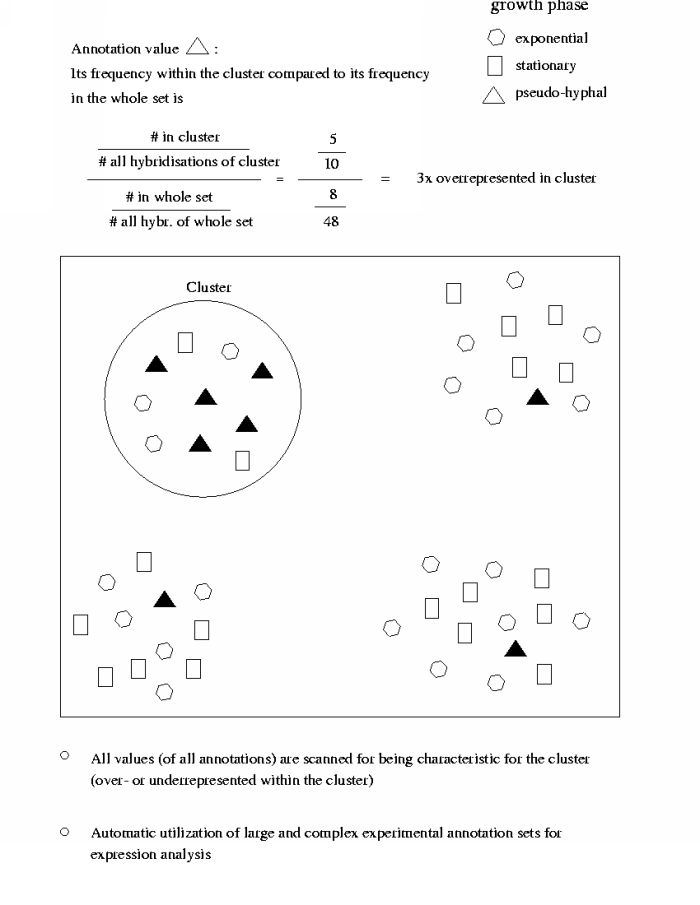
Let the above scheme be for example a correspondence analysis plot. We see
all the hybridisations resembled by their annotation value for this specific
annotation. Let's count the representation of the triangles in the encircled
(choosen) cluster. 5 out of 10 hybridisations in the cluster are annotated as
triangles. Compared to (that is devided by) 8 out of 48 hits in the entire
set of hybridisations this results in that the triangles are 3x
overrepresented within the choosen cluster.
In the same way all the
annotation values (of all the annotations) are scanned for being
characteristic (that is over- or underrepresented) in the cluster by an
algorithm.
For our outlying cluster in practise that means that selecting
the cluster by mouseklicks yields the following list of values being more or
exactly two time over- or underrepresented:
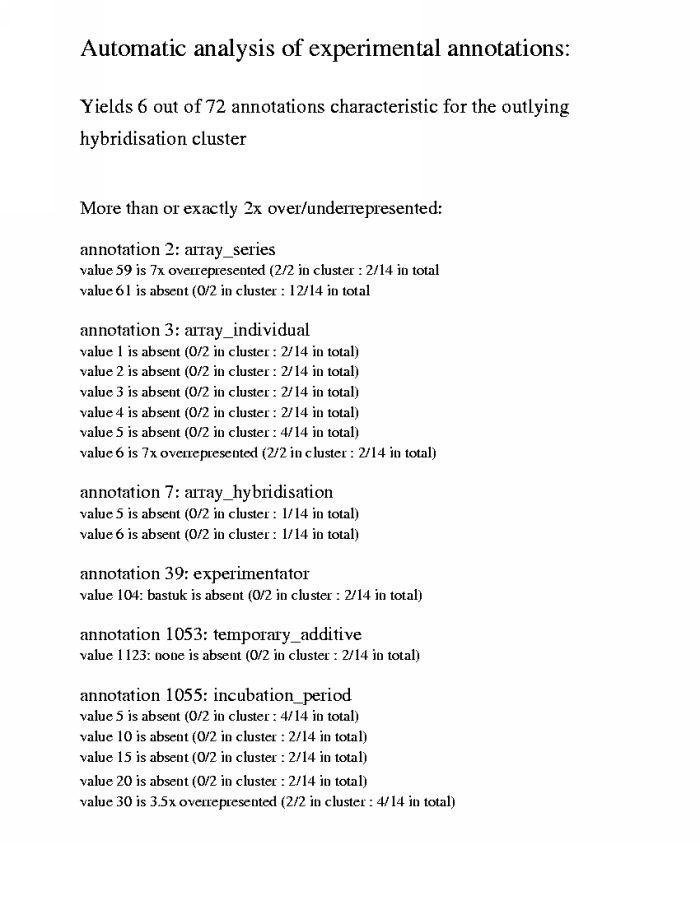
All but one of these annotations can be
excluded
when considering their meaning in the experimental context. The remaining one is array_series, meaning the array production
batch:
It turns out that the cluster is due to a different array production
batch, only these two hybridizations had been performed on. This artifact
distorts the projection of an otherwise sound and revealing dataset: Repeating the
correspondence analysis disregarding the two outlying hybridizations
performed on array series 59, the plot looks
rather different.
Above way, artifacts like this one or also biologically relevant parameters driving the
cells to the observed transcription patterns can be extracted. Simple as it
may be, the described method already provides good analytical access to long lists of
annotations and huge sets of hybridizations, which could hardly be evaluated
by visual inspection. While this is a simple and easy to explain way to do
so, statistical tests would certainly better suit this task. Hovever, while
analysis may be trivial, it's the way of storage that
matters here: Any
statistical analysis will require that the variables (annotations) are of
categorical range and that instances of occurance can be counted for any
annotated value. Free text representation impairs direct statistical
analysis! Missepllings, different textual representations of
semantically identical items, and, vice versa, ambiguous words whose
meaning depends on the context, interfere with counting such values. With
these limitations to access for computer based, i.e. statistical analysis,
global studies of large data sets would not be possible.
